Over the last few weeks, we’ve been battling a problem where the web server would sometimes forget its own name. Some days it would want to go by www.lanecc.edu, other days it would want to go by 163.41.113.43 (our public IP address), and other days it would use our internal server name. We gave it a stern talking to, but it refused to cooperate.
The solution is to specify Drupal’s base_url variable. Normally, Drupal tries to identify what server name to use and it does a pretty good job. But clearly our server isn’t so great at that anymore. Specifying the base_url forces Drupal to use what we tell it.
But the base_url needs to be a full URL, complete with protocol. So it needs to be “http://www.lanecc.edu” or “https://www.lanecc.edu” – we’re not allowed to just say “www.lanecc.edu”. Why does that matter? Because even though the difference is just one letter – an “s” – that turns out to be one of the most important letters on the Internet.
HTTP is the protocol that defines how a lot of content on the internet moves around. It’s part of how this page got to you. But it’s a completely unencrypted format. When you’re browsing the web in HTTP, you’re sending everything in clear text – anyone that can listen in (for example, on an unencrypted WiFi connection) can read whatever you’re sending. But if we add the “s”, and browse via HTTPS, then everything we do is encrypted, and no one can listen in*.
But there’s some gotchas with HTTPS pages. For instance, most webpages actually consist of multiple requests – the Lane homepage has 34. If even one of those requests is made over HTTP instead of HTTPS, then we have a “mixed mode content error”, and the browser hides that content.
And that’s kept us from specifying our base_url so far. If we set it to “http://www.lanecc.edu”, then on pages that are HTTPS, like webforms, then all the styles and javascript will break, since those would be sent over HTTP. And if we went the other way, and set the base_url to “https://www.lanecc.edu”, then our caching infrastructure, which is built assuming most connections are over HTTP, would break, significantly slowing down the site. So we’ve been stuck running a mixed-mode site – most people use HTTP, but authenticated people and webform users use HTTPS.
There’s a number of reasons that isn’t ideal, which are well outside the scope of this already too long blog post. And the wider Internet is moving forward with using HTTPS only everywhere. So yesterday, we deployed new caching infrastructure which will allow us to go with using HTTPS only. Going forward, all connections with www.lanecc.edu will be encrypted.
This should be a almost completely transparent transition, but if you notice any problems, email us at webmaster@lanecc.edu and let us know!
* strictly speaking, this isn’t true, and there’s a a whole category of attacks that can still work on HTTPS. But there’s a fix for that too, and we’re working on rolling that out too some time in the future.
As I may have blogged once or twice previously, making websites really fast is important to me. Recently, we’ve made a change that should help us improve the speed of not only www.lanecc.edu, but of many of Lane’s other websites, including this one.
When you request a webpage, in addition to fetching the page itself, you usually end up requesting each individual image, font, css sheet, and javascript sheet. Making those requests is expensive. There’s a sliding window, which limits how many requests you can make at once. So if the window size is 5, but you need to make 6 requests, you need to wait for one of the first 5 requests to finish before you can make the 6th. On the other hand, if you only need to make 5 requests, your browser can start rendering the page a lot sooner.
One way is to combine images into a css sprite. Here’s ours:
That’s 15 different images combined into one. And even though there’s empty space on the bottom right, it’s actually usually faster to fetch a slightly bigger image then it is to fetch each icon individually.
Another way is CSS and JavaScript aggregation. Most pages on our website have 35 CSS sheets and 35 JavaScript files – but after aggregation, you only end up requesting 7 of each (there’s reasons why 7 of each is better then just 1 CSS and 1 JS, but that’s outside the scope of what we’re doing here).
But the easiest way to speed up a request is to not make it at all. When you make a request, you send some request headers with it, that tell us things like if you’ll accept a compressed version and what language you prefer. Then we respond with a header that tells you how long you should keep our response cached on your computer. If you need that resource again before the expires time we gave you, you just use the local one, rather than fetching a new one.
In addition to sending headers with your request, and us sending different ones, we also send each other cookies.
baked by https://www.flickr.com/photos/plutor/3646688/in/photostream/
Cookies are always set on a domain. When you log into Moodle, cookies are set on the domain classes.lanecc.edu, so Moodle knows on every page load that you’re logged in. But here, on the Lane website, we’re not so lucky, as you can actually use the website on either www.lanecc.edu, or on just lanecc.edu. So we set our cookies on .lanecc.edu. That little dot before lanecc.edu is critical. That tells your browser to send your cookies to all domains that end in lanecc.edu.
The downside is that those cookies are sent on every request to our domain – even requests that don’t need them, like the request your browser made to show you the picture of those cookies up there.
What does this have to do with static?
We’ve started moving relatively static (unchanging) resources, like the college logo and the megamenu onto the static asset server, which we’re putting on the domain static.lanecc.net. Since these resources are relatively unchanging, we can set a long expires time – maybe 30 or even 45 days in the future (for now, it’s set to 0minutes in the future, for testing). Once your browser has fetched them, you won’t need to fetch them again for a whole month. And because they’re not under the lanecc.edu domain, you won’t send any cookies (and we won’t send any back), making the few requests you do need to make even smaller.
If you’re really curious about the inner workings of our new static asset server, I’ve added some extra geeky content to the Our Tech Stack post.
In the months to come, we’ll keep migrating content onto the static asset server, trying to reuse resources between websites, so that the logo you see on myLane is served from the same URL as the logo you see in Moodle, reducing the number of requests you need to make, and making it simpler for us to update things in the future.
Back when we first started the website redesign, we received a lot of feedback about how our search engine – https://search.lanecc.edu – didn’t work very well. Now most of our questions are about altering the behavior of the search engine to make it work differently. Over the next few posts, I’d like to explore what changed, as well as why not every request can be responded to, as well as dig a little bit into what you, as a Drupal editor, can do to improve how the search engine views your pages.
How does search work at Lane?
We use a Google Mini search engine, which allows us to index and search up to 50,000 documents. We have complete control over what pages are in our search (the “index”), and limited control over what’s shown in the results. Also, it’s blue, which is a nice contrast to the beige and black of most of the machines in the data center.
The first big change we made to search as part of the redesign was to upgrade our Google Mini, which we did in early 2012, switching to a brand new search server with upgraded hardware and software. We found a pretty immediate improvement – no longer did it feel like using an old search engine from ’05 or ’06, and instead it felt like using one from ’10 or ’11. Unfortunately, Google has discontinued the Mini, and there will be no further upgrades. We’ll need to find a new solution in the future (Apache Lucerne?).
Along came a migration
Then we started migrating pages to Drupal. This brought with it a bunch of new practices that we’ll get into some other time, but all of which dramatically increased the relevance of search. The down side is that we changed virtually all of the URLs for pages on lanecc.edu (Yes Sir Tim, I know it was a bad idea). While we’ll hopefully never need to do this again, it meant there was some confusion in the results for a while.
The migration also meant that we cut a lot of pages. More than 10,000 of them. Enough pages that cutting them significantly changed how the mini calculated page rank. We’re still removing these from the search index. It’s a slow process, since we don’t want to delete more than one or two folders worth of files each day, so that if someone was still depending on a page or image that didn’t get migrated, it won’t be as hard to get that person their missing files.
Reset
Since the mini wasn’t removing pages that had long since disappeared, we decided to reset our search index. This is pretty much what it sounds like. We tell the mini to forget about all the pages it knows, and start over from the beginning. When we did this last, around Thanksgiving, our document count in the index went from about 40,000 all the way down to 16,000. We think results improved quite a bit.
We’ll reset again around Christmas, which is traditionally one of the slowest days on the website. Hopefully that’ll bring the document count down even more, and make results even better.
Biasing
At the same time as our last reset, I figured out that I’d been using Results Biasing incorrectly. Results Biasing is a way that we an introduce rules into the search engine to influence the results. Our first rule tells the mini to significantly decrease the pagerank of urls that end with xls or xlsx, under the assumption that when you’re searching Lane, you’re probably not interested in some Excel sheet.
I thought that by simply entering rules in the Results Biasing page on the mini administrative interface, I was affecting the search results. Turns out this isn’t actually true. There’s a second radio button to hit on the Frontend Filter, where you actually enable Result Biasing on the collection that frontend is searching. What are containers and frontends? A container is a collections of urls that match certain patterns. For example, we have a container of just pages that match pages related to our COPPS pages, and another just for the Library. Frontends are the user interface to those collections, where you can customize what the search button says, what the background color of the results is, etc. You can use any front end with any collection, but in our case each frontend belongs to just one collection.
Feedback
The other big thing we did to our search was to add a feedback form in the bottom right hand corner of the search results page. To date we’ve had 40 people let us know about their searches that didn’t get them the results they needed. Many of those have resulted in us making a tweak to the search engine, either adding pages to the index, or adding a KeyMatch, or fixing something on the page to improve its visibility.
Feedback has started to taper some, while queries have stayed steady (if you adjust for changes in enrollment), so our assumption is that search is working pretty well. If it isn’t, please submit some feedback!
Next time
Now that we’ve got some basics out of the way, next time we can dig into how search engines calculate results (If you’d like some homework, here’s a bit of light reading), as well as more of what we can do to influence those results.
Currently, we use a plugin called LinkIt to handle linking between our pages (for a discussion of how we use it, see https://blogs.lanecc.edu/webteam/2013/02/05/common-pitfall-links/). LinkIt is pretty neat, and helpful. But it was always a pain for people to link to internal pages. We’d often get a scenario where someone wanted to link to some page, say, their department contact page. So they dutifully use LinkIt, and start searching for pages with titles like ‘contact’. But since every department has a contact page, they’d get fifty results and spend forever hunting for the right page.
Not helpful.
In fact, it was so unhelpful that people were directly pasting links to their pages into the page, meaning that when page titles changed, things started to 404, and things just got nasty. So I spent some time investigating why LinkIt couldn’t just figure out if a given URL is internal, and if so look up the node number and properly insert the link like a good little plugin.
Turns out the developers had already thought of this. Right there on line 388 there was a little todo that explained our problem. Like any responsible web site, we’re forcing page edits to happen on HTTPS. But for non-administrative users, we’re serving up most pages via HTTP (so we can take advantage of the speed our Varnish server provides us). So when an editor copied a link into LinkIt, the server would check the link (for example, ‘http://www.lanecc.edu/contact’) and see if the start of that link matched the scheme and server name of the current page. Since we’re forcing https, that’d end up being something like https://www.lanecc.edu/node/1337/edit. The server name matches, but the scheme doesn’t, and LinkIt would report that this link was external.
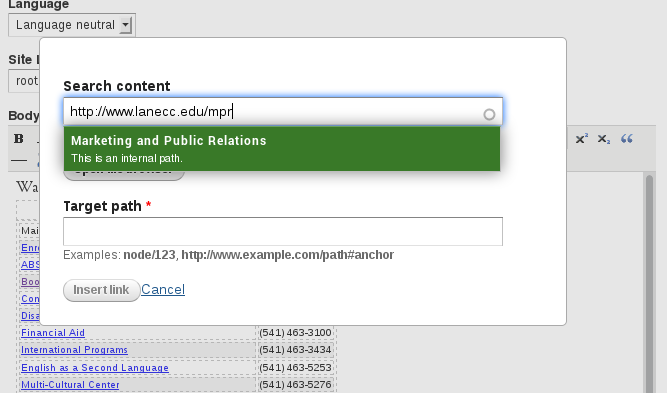
One simple change later, and now when you paste in a link it decides not to check the scheme. So from now on, if you’re linking to an internal page, just paste your url into the top box, and you’ll see something like this:
When that little green popup appears, simply click on it and LinkIt will automatically identify your node number and insert it as the target path. Click Insert Link, like normal, and you’re good to go.
The second change is that we got spell check working on Internet Explorer 9. For others with a similar problem, our issue was on Drupal 7, using TinyMCE 3.something, with the wysiwyg_spellcheck module and wysiwyg modules enabled. Turns out that when you enable the module, you also need to make some changes to wysiwyg/editors/tinymce.inc. In the function wysiwyg_tinymce_settings, you need to add add another key to the settings array:
'spellchecker_rpc_url' => '/libraries/tinymce/jscripts/tiny_mce/plugins/spellchecker/rpc.php',
You should, of course, adjust that path to whatever is appropriate for your site. One final note, the problem described with LinkIt is actually fixed in the new 7.x-3.x version. But we’re using the older, 7.x-2.x version, which is no longer in active development (and which has no migration path to 7.x-3.x)
We’ve mentioned a few times in meetings around Campus that we’re tracking search volume on our Google Mini. Our plan has been to use the last year’s data to see how the new website impacted visitor’s abilities to find different things. In other words, if for the last year everyone searched for “Schedule”, and now suddenly no one searches for “Schedule”, we can assume that we succeeded in making Schedule more visible. On the other hand, if no one used to search for “Moodle”, and now suddenly everyone is searching for “Moodle”, we know it’s hard to find Moodle.
We also tried to make the MegaMenu as small and as lightweight as possible, to make it load as quickly as possible. Right now the entire Megamenu uses about 30k – less than your average Internet Cat Picture.
For example, this picture uses 31k.
But unfortunately, when we put these two things together – a super optimized mega menu and a desire to track search engine statistics – something broke.
The Google Mini has different collections. For example, we have a collection that searches just our COPPS documents. The biggest collection is the default collection, which searches all the pages in the index (all collections, plus pages not in any other collection). When you search the Mini, a bunch of parameters are sent in with your query, telling the Mini which collection to use, which set of styles to apply, etc. If you omit all of these parameters, search still works – the default collection is searched and you’re shown your results in the default front end. I assume that also meant that the searches were logged as belonging to the default collection.
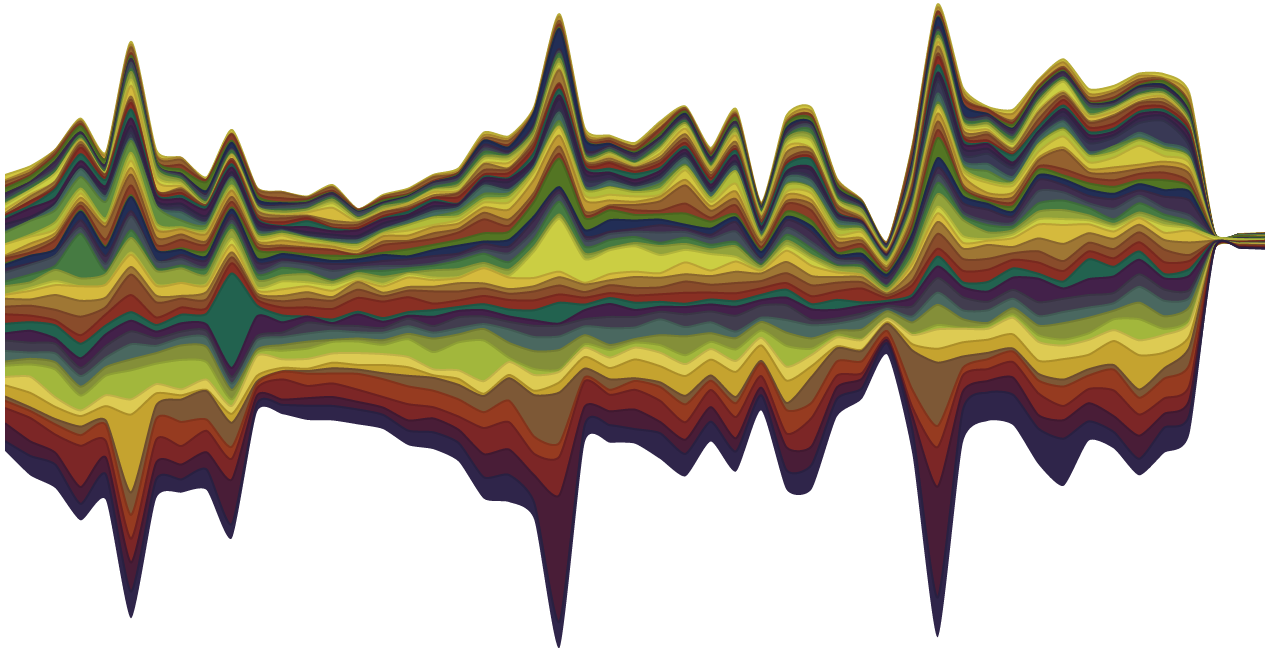
Unfortunately, it turns out this is not the case. Here’s a streamgraph of our search traffic:
428/12 – 4/13/13
See that real small area on the right hand side, where traffic falls off a clif? For the last two weeks searches were correctly logged in the search engine, but are not given to the default collection for inclusion in search reports – effectively making them invisible to us.
We added the hidden parameters to the search bar in the MegaMenu, and verified today that we’re seeing an 800% increase in search traffic in reports over what we saw yesterday. Apparently those parameters are not as optional as I thought.
In a way, this error isn’t a big deal. Right after launch, we expected a surge in search traffic as people searched for things before getting comfortable with the new layout. So we’d always anticipated throwing out the last two weeks of data in our analysis. But as a bit of a data nerd, I’m always sad when any data is lost, and we’ve had a hard time interpreting how people are interacting with the new site.
I’d also like to point out that we added the MegaMenu to the search results page. If you search for something via the search engine and discover that you’re not getting the results you want, you can also try AskLane from the search box on the MegaMenu. Of course, we’d also encourage you to submit some search feedback to us (the form moved to the bottom right), so we can try to improve the search engine to give you better results.
Two final notes. If you ever find yourself managing a Google Mini, and pulling your hair out because the new XSLT you applied isn’t rendering your new styles, it’s because you need to add &proxyreload=1 to a search string, to clear the style cache. Second, this weekend we’ll swapping www and www2 (don’t worry – all links will continue to work regardless which one you use), and as part of that we’ll be resetting the search engine index. That should clear out a lot of old pages that aren’t really relevant any more, and are no longer linked, but are still out there on our old web server. It’ll take most the weekend to rebuild the index, but hopefully next week you’ll get even better search results.
Once again, we’re on a quest to make the website as fast as possible. Drupal doesn’t make this easy – on an average page load, our request for that page passes through three servers, sometimes generating hundreds of database calls and touching dozens of files. But through caching, we’re able to skip most of those steps and serve you content that was already waiting for you.
Now that we’re a couple of weeks post launch, we’re going to start making our caching a little more aggressive. If you’re a web editor, this might impact you.
Previously, the cache time on all of the objects (pictures, fonts, stylesheets, etc) on our pages was set to six hours. This makes sense the first few days after a big launch – we were anticipating lots of changes. But now that things have stabilized some, we’re turning up the cache lifetime on our stylesheets and javascript files to one year, and turning the cache lifetime of images up to one month. For 99% of visitors to the Lane website, this will result in up to 17 fewer requests to our servers – a 70% savings – creating a significantly faster web experience.
Unfortunately, this also means that there’s certain circumstances when a picture you’ve added to your website remains in the cache, and you’re unable to force someone to use a new one. Let’s say that you have a picture, called “kitten.jpg”, of a kitten eating a hamburger. You save your page, and people flock to see your awesome image. Every one of their browsers sees that the picture has an expires header of 111600 seconds – 31 days. Next time they visit your page, their browser won’t attempt to download that picture again unless at least 111600 seconds has passed.
The bad situation happens when you want to replace your kitten picture with a better one (say, a picture of your kitten eating a cheeseburger). You upload your new file as “kitten.jpg”. But your visitors will never see the new picture – their browsers see the same filename, and they know that particular file hasn’t expired from their cache yet.
So how do you fix it? Well, for one, remember that the picture will automatically fix after 31 days. But if you need an immediate fix, there’s a simple trick. Just rename your picture as “kitten2.jpg” and add it to your page like a new image. Now when the browser visits the page it’ll realize that it doesn’t need kitten.jpg anymore, and grab kitten2.jpg instead. We’re setting the cache at 1 year for JavaScript and stylesheets because we’re able to depend on Drupal to create new stylesheet and JavaScript names automatically when they change, and effectively do the same thing as we did with kitten.jpg in the example.
Things are actually a bit more involved than what’s above, but it’s not worth the extra confusion. If you’re interested in how we’re actually implementing caching, please send me an email or leave a comment.
I know this extra renaming step might seem painful, but we can’t ignore page speed. Google is incorporating speed into their rankings, and for users on slow connections (3g, in particular), we want to make sure the page renders in less than 1 second. Caching will take us a long way towards where we want to be.
Over the last year, we’ve occasionally been posting about page deployments from the old Lane site to the new Lane Drupal site. Today, we dramatically improved our testing infrastructure, and took a step towards a better, more accessible website.
Before we can explain that step, you need at least a grossly simplified idea of what it looks like for us to move pages. Essentially all we’re doing is manually copy and pasting over content from the old site to pages on the new site, then properly formatting and linking everything. Easy with one or two pages, but when doing a chunk of a hundred pages, it’s a tedious and time consuming process. And, as with any tedious process, it’s prone to errors.
So how to we ensure that everything worked right after a deployment? Our principle tool is a Link Checker, which is a type of Web Spider. A spider, once given a page to start on, follows all the links on that page, and then all the links on those pages, and so on. Eventually, it establishes a kind of web of a website.
When we first tried to find a spider, we found several that almost worked. The one we got furthest with was, appropriately enough, called LinkChecker. But it wasn’t quite right for our needs, and we had a lot of difficulty trying to extend it. So we did what any self respecting, overly confident programmer would do, and wrote our own.
Our first pass worked pretty well – checking some 13,000 pages and all their hundreds of thousands of links in about half an hour. But like any tool, before long, you want more power!
We experimented with adding some rudimentary spell checking, but found that doing a complete check of our site could take as long as 4 hours! And there were so many other things to add.
Over the last couple days, we’ve done a complete rewrite and realized significant speed gains. Instead of 30 minutes to check the site, it now takes 7. And adding in spell checking only makes it take 12. We also added a few other features:
Hotlinking Checks:
It’s possible to include an image on your page that’s technically stored on another server. This practice is called “hotlinking” and is generally discouraged (some things, like Facebook icons or Google Docs embedded images are ok), since it can lead to awkward situations where the hosting server either removes or changes the image – effectively controlling content that’s displayed on your site. We’re now checking to make sure that all the images you include are local (or are part of a list of allowable sites)
Alt Tag Checking:
According to accessibility rules, images are supposed to have alt tags to help visually impaired people identify what’s in the image. They’re really easy to add, so we really have no excuse not to include them every time we put an image on one of our pages. We’re now logging images that are missing alt tags.
External Link Checking:
Previously, we were only checking links within the Lane website. We’ve now expanded that to check links off site.
Page Title Checking:
It’s still in experimental mode, but we’re adding page title checking to make sure that none of our pages have redundant titles for SEO reasons.
Phone number formatting:
We added a few checks to make sure that all phone numbers are formatted appropriately, so that you can click them to make a phone call.
Email address formatting:
Similarly, we’re now making sure that all mailto: links have a properly formatted email address after them.
The broader, more important thing we did was to make sure the framework for our link checker is easier to extend – simplifying new tests in the future. And, because its so much faster, it’s “cheap” to run a test, meaning we can do them more often to catch problem areas sooner.
Now, on to the broader problem of actually fixing all the new problems on the site we’ve uncovered….
Recently, the Webteam was tasked with formalizing the procedures we use for testing websites and applications for cross browser compatibility. When we put together our initial design, we tested against 17 different browser/operating system configurations in person, then looked at another few dozen configurations through browsershots.org. Thanks to all our testing, so far we’ve only had one browser issue – which is only in one version of Chrome, on one version of Windows, on one particular screen resolution. I’m pretty happy with that.
But browser popularity changes, and people are regularly upgrading their devices. It’s been over a year since we last launched a design. Charged with formalizing procedures or not, as we get ready to develop a new theme for the Lane website, it’s time to take a look at what devices are accessing our website.
For this data set, we’re actually only going to look at data from the last month – Oct 6, 2012 to Nov 5, 2012. We won’t be getting as complete a picture, but we also won’t see traffic from earlier this year, before some of the more recent browsers were even launched. We’ll start with a super high overview, then dig in deeper.
Browsers & Operating Systems
So from this data we can conclude that the average (median) person visiting the Lane website is a Windows user with Firefox. Of course, we know that there’s a ton of different browser versions out there, so the story might be much more complex. But this data is still useful. Doing the same sort of extensive testing we do with the main website (millions of visits a year) with all of our sites (example: this blog, which sees about 4,000 visits a year) would be prohibitively time consuming and expensive. Testing on the latest versions of Firefox, Chrome, and IE on Windows, and then Safari on a Mac is probably good enough for most of our smaller sites.
But let’s go deeper.
Whoa! Sorry you can’t click the little down arrow and see all three pages of the key. I’m only looking at the top 100 browser versions, and I’m combining minor version numbers (treating Firefox 3.6.3 and Firefox 3.6.5 as just Firefox 3.6.x). That still leaves us with 39 different browser/version combinations.
Turns out that the average person is actually an Internet Explorer 9 user. And their operating system:
As expected, most people use Windows. There’s no way to generate a graph of browser, version, and operating system (and it might be too complex anyway!), so we’ll have to conclude our analysis here. But we’ve learned a few things. For one, Safari on Windows, Chrome Frame, and Linux all aren’t important to us. And we’re probably ok to stick with our high level testing plan for basic sites – it’ll still cover a majority of users.
Screen Resolutions
Screen resolutions are usually listed as number of pixels wide by number of pixels tall. Pixels tall can be useful to know, as it helps us determine where the “fold” is. But at this stage we’re mostly concerned with width, since that more directly impacts layout. This used to be simple to do, but with the advent of tablets that rotate their orientation, screen width has become a little more fluid: 1024×768 and 768×1024 might actually be the same device. For the purposes of our analysis, we’ll just assume that tablets don’t rotate. As long as we’ve set our media queries appropriately, things should still work.
There’s something else to consider here. A device that’s 1024 pixels wide will have trouble displaying a webpage that’s 1600 pixels wide. But there’s no issue the other way. So we’re really looking for a lowest common denominator. In this case, I’d submit that our lowest common screen resolution is 1024×768. It’s ancient, yes, but it’s also the standard resolution on most tablets.
In our case, we set our media queries up as:
Global: <740px
Narrow: 740px to 979px
Normal: 980px to 1219px
Wide: >1220px
Is this a good fit? I think so. It a content area gets to be too wide, it gets to be hard to read. So though it’d be totally justified to have a media query for browsers that are greater than 1400 px wide, I’d argue that it’d be hard to maintain the same look and feel without decreasing readability. And we should be ok with the tablet assumptions we made earlier – most should jump between narrow and normal view depending on orientation, but shouldn’t fall to a cell phone optimized view.
Java Support
28.38% of visitors reported no Java support. Although its a free plugin, we should probably seek alternatives whenever possible.
Flash Support
Although Google Analytics doesn’t provide us with a simple way to check Flash support, we can assume that “(Not Set)” is a reasonable guess at “Not Supported”. In this case, about 13% of our visitors don’t support Flash. Since 7-8% of our traffic is mobile, and we know that iOS devices don’t support Flash, this sounds about right. The lack of support we’re seeing here is a good reason for us to try to move away from Flash on our pages wherever possible.
Mobile Devices
Compared to this time last year, mobile traffic is up 50%. We’ve got to keep thinking mobile. What devices do people use? iPhones. Followed by iPads. In fact, the next 10 devices put together only add up to 1/3 the traffic we get from iPhones. For every Android device visiting a page, there were 2 iOS devices visiting that same page.
But Androids aren’t insignificant. In fact, more people visit via Android than people do via IE7. So let’s have a look:
It looks Android 2.x hasn’t quite gone away, although we seem to have skipped Android 3. When testing phones, we should probably be sure to find a mix of Android 2.2, 2.3, and 4.0 devices.
What Now?
Now that we’ve drawn together all our data, its time to make some decisions about testing procedures. We’ll convene as a web team, go through all our data, and try to come up with a check-list. Except to see some further details soon!
Last time, we analyzed where people go on the Lane website. This time, we’re going to wonder how they found the Lane website in the first place.
That’s right. This post has pictures.
We’ve analyzed our SearchTraffic to death, and right now our Campaigns (targeted emails and such) aren’t a significant source of traffic. Direct traffic isn’t very interesting, since it’s just people that type our URL into the address bar of their browser (or are referred from an evil website that prevents us from seeing referral information – more on that later). But we can learn a lot from Referral Traffic, which we can define as visits from people who found us by clicking on a link on another website.
Of course, not all referral traffic is equally interesting. I exported the top 500 referral sites (anyone who has sent at least 52 visitors last year) to a spreadsheet, and went to work.
The vast majority of our referral traffic to www.lanecc.edu is actually traffic from another one of our Lane websites – Moodle, MyLane, etc. So let’s ignore those for now – although unifying navigation is a goal, we can’t also do that in this blog post. While we’re at it, let’s ignore the 7% of referral traffic that came from search that Google Analytics didn’t identify. I’m being a little generous at what constitutes search – people that are squatting on a domain and putting a search bar on it to collect ad revenue should really count as “Bad People”, but we’ll pretend they’re legitimate search engines here.
We’ll also ignore AskLane, our Knowledge Base about Lane. It’s a useful tool, but people generally find it from a Lane website, so we shouldn’t count it as a distinct referrer.
That’s better. It’s also not entirely accurate. The number of people who come to the Lane website via Email is likely much higher, but some email providers make it impossible to see that they were the referrer – even Google’s own email service. If you’re a department here on campus, and you’re thinking about sending out a mass email, come talk to us first – there’s things we can do to make it super easy to identify who’s clicking your email links.
Let’s look at each of the other categories one by one. Keep comparing each category against the overall averages – referral traffic averages 2.98 pages/visitor, about 4 minutes on site per visitor, with a new traffic rate of 23% and a bounce rate of 55%.
Social Referrals
Google Analytics actually provides a much more comprehensive interface for analyzing Social traffic. So we’ll augment our data set.
I think that graph kind of speaks for itself. And forget about the other 13 Social Networks (including Tumblr, MySpace and Pinterest), who send so little traffic that they don’t even show up. But is there a difference in the quality of traffic from Social Networks?
I think it’s clear that yes, there is a difference. For pages per visit, we want the bar to be as high as possible – an indicator that the average visitor not only came to the site, but they then explored some other pages. In this case, the clear winner is Naver – a Korean Search and Social Networking Site. The biggest losers are Delicious and Facebook. So even though Facebook sends us 92% of our referral traffic, most of those visitors only view one page and then leave.
We see a similar pattern in Bounce Rates (percent of people who view a page then leave. Facebook and Delicious have terrible Bounce Rates. Twitter (shown as t.co, since t.co is Twitter’s URL shortening service, and thus is the referrer) fares only a little better. But both Google Plus and LinkedIn tend to send us visitors that visit at least one other page. They also tend to send us more visitors that are new – 16% and 19%, respectively, compared to 9% for Facebook and 4% for Twitter.
Lessons? Facebook is so big that its impossible to ignore, but its also some of the worst traffic. Don’t ignore the other networks.
Government Referrals
Visitors from government websites have better than average statistics. Here’s the complete list:
Source
Visits
Pages / Visit
Avg. Visit Duration
% New Visits
Bounce Rate
ltd.org
5642
2.24
0:02:48
8.53%
63.58%
oregon.gov
3354
4.24
0:03:37
58.86%
36.49%
stateoforegon.com
1780
3.65
0:02:53
78.71%
43.54%
eugene-or.gov
750
3.87
0:03:22
52.93%
47.07%
cms.oregon.gov
616
4.39
0:06:38
43.18%
29.87%
public.health.oregon.gov
539
4.02
0:05:20
63.45%
33.58%
ode.state.or.us
133
2.98
0:02:25
33.08%
51.13%
www1.eere.energy.gov
111
3.27
0:02:54
50.45%
63.06%
ci.florence.or.us
107
4.27
0:04:25
50.47%
38.32%
odccwd.state.or.us
103
2.73
0:02:35
59.22%
57.28%
egov.oregon.gov
94
6.2
0:05:09
24.47%
19.15%
nces.ed.gov
85
6.13
0:07:30
61.18%
23.53%
ci.corvallis.or.us
75
2.83
0:01:54
52.00%
48.00%
boli.state.or.us
63
3
0:02:35
26.98%
49.21%
ci.springfield.or.us
53
2.47
0:03:59
11.32%
47.17%
Averages:
900.3
3.75267
0:03:52
44.99%
43.40%
In the interest of not writing the world’s longest blog post, I won’t go into too much detail, but there’s a lot of questions to ask. Are visitors from www1.eere.energy.gov looking for info on our Energy Management program? Are the visitors from public.health.oregon.gov looking for Health Professions information? Knowing that, can we do anything to help those visitors?
Educational Referrals
Once again, here’s some data:
Source
Visits
Pages / Visit
Avg. Visit Duration
% New Visits
Bounce Rate
oregonstate.edu
846
3.02
0:05:52
10.05%
50.00%
utexas.edu
801
2.86
0:02:10
78.28%
55.43%
lcsc.edu
786
2.72
0:02:14
49.49%
57.76%
osba.org
567
3.52
0:02:18
73.37%
45.15%
ohsu.edu
387
2.34
0:02:56
23.77%
69.51%
umpqua.edu
333
3.47
0:03:59
22.52%
52.85%
nac.uoregon.edu
331
1.17
0:00:57
0.00%
91.54%
oregoncis.uoregon.edu
330
3.86
0:03:54
36.67%
47.88%
blogs.bethel.k12.or.us
327
3.46
0:05:34
44.34%
33.64%
uodos.uoregon.edu
306
3.78
0:14:27
3.27%
37.25%
Averages
247
2.8339
0:03:50
32.59%
53.51%
The averages don’t add up right, but that’s because I’m only showing the top ten here.
Why do some of these referrers have exceptionally high (78%) new visitor rates? Let’s dig deeper into traffic from utexas.edu. In this case, it turns out that the University of Texas maintains a list of Community Colleges around the country, and this is the source of almost all of the referrals. If we follow the visitor flow of those visitors, we get this:
Click the image to see a bigger version with legible text
So there’s people in Texas, looking at a list of Community Colleges, who click a link to our website. They look at some basic informational pages, and then go away. Do they come back later? (We get 29,000 visits a year from Texas, either as direct links or Search). Digging even deeper into this visitor flow, I can see that Texans are looking at many of our pages in Spanish. Should we further develop our translated pages?
Employment Referrals
Source
Visits
Pages / Visit
Avg. Visit Duration
% New Visits
Bounce Rate
qualityinfo.org
1236
3.05
0:03:49
44.09%
58.33%
worksourceoregon.org
869
2.61
0:02:46
17.38%
64.67%
eugene.craigslist.org
794
2.46
0:03:01
19.90%
59.32%
univjobs.com
556
2.42
0:00:49
69.78%
15.47%
academic360.com
368
2.46
0:00:50
65.22%
11.68%
higheredjobs.com
170
5.04
0:02:44
83.53%
37.06%
chronicle.com
55
3.55
0:04:47
80.00%
54.55%
Averages
578.2
2.981
0:04:07
23.08%
55.00%
Having dealt with more than a couple hiring committees, I’ve always been curious to see what sites with job listings send traffic our way. Strictly speaking, the above is a pretty poor list. Most of our job postings link directly to the job post at jobs.lanecc.edu, so we may not see all the traffic in the above table.
College Guide Referrals
These are websites that attempt to guide you into picking a college, or provide listings of colleges with certain programs.
Source
Visits
Pages / Visit
Avg. Visit Duration
% New Visits
Bounce Rate
oregoncollegesonline.com
945
3.05
0:03:44
40.21%
52.59%
technical-schools-guide.com
433
4.01
0:02:51
62.59%
37.18%
medicalassistantschools.com
245
3.84
0:03:04
47.76%
46.53%
flightschoollist.com
235
5.55
0:04:39
66.38%
35.74%
bestaviation.net
167
7.38
0:04:55
67.07%
14.97%
communitycollegereview.com
156
2.96
0:02:30
54.49%
48.08%
nursingschools.com
142
3.47
0:03:39
78.17%
35.92%
studyusa.com
129
5.81
0:06:46
70.54%
31.78%
a2zcolleges.com
123
3.93
0:02:50
75.61%
46.34%
justflightschools.com
108
6.55
0:04:16
76.85%
22.22%
communitycollegesusa.com
106
6.09
0:07:01
44.34%
31.13%
educationatlas.com
92
2.78
0:01:35
84.78%
50.00%
artschools.com
90
4.77
0:03:06
70.00%
21.11%
braintrack.com
90
3.58
0:03:19
51.11%
32.22%
universities.com
89
3.19
0:07:07
8.99%
48.31%
collegestats.org
87
3.98
0:03:42
81.61%
37.93%
collegeview.com
83
4.23
0:04:07
54.22%
26.51%
aviationschoolsonline.com
69
5.71
0:04:10
79.71%
20.29%
campusexplorer.com
63
5
0:05:43
55.56%
22.22%
uscollegesearch.org
63
4.95
0:02:58
80.95%
34.92%
community-college.org
62
3.82
0:02:08
87.10%
46.77%
collegesearch.collegeboard.com
55
4.58
0:03:03
74.55%
29.09%
Averages
165.09
4.51
0:03:57
64.21%
35.08%
If this wasn’t already a record long post, we could try to compare programs – do referrals for flight programs differ from referrals for health professions programs? Is there something either of these programs could learn from each other to try to drive more traffic to their pages?
News Website Referrals
Source
Visits
Pages / Visit
Avg. Visit Duration
% New Visits
Bounce Rate
coder.targetednews.com
359
1.37
0:00:36
9.19%
72.14%
special.registerguard.com
155
2
0:03:44
8.39%
67.10%
eugeneagogo.com
80
2.22
0:01:48
21.25%
62.50%
eugenedailynews.com
67
2.78
0:04:07
10.45%
56.72%
oregonlive.com
57
1.98
0:00:46
45.61%
59.65%
myeugene.org
55
7.62
0:21:53
9.09%
34.55%
Averages
128.8
2.995
0:05:29
17.33%
58.78%
Here we can ask questions like: why do visitors from myeugene.org spend so long on the website?
Everybody Else
The last 18% is the hardest to figure out. Some are sites like tiki-toki.com, where we host some time lines, but aren’t really Lane webpages. Others simply don’t resolve to anything any more – it’s like that website isn’t on the Internet any more. And others appear to have been proxies that purposely disguise the referrer. But if I cut out ones that really seem to be irrelevant, and we look at the top 30, here’s what we get:
Source
Visits
Pages / Visit
Avg. Visit Duration
% New Visits
Bounce Rate
nwaacc.org
1366
1.83
0:01:41
51.54%
63.98%
planeteugene.com
1179
2.61
0:01:57
39.78%
32.99%
en.wikipedia.org
1167
3.8
0:02:42
68.98%
43.70%
oregonchildcare.org
712
3.09
0:05:40
19.94%
38.06%
nweei.org
497
3.71
0:03:28
32.39%
44.27%
osaa.org
494
1.75
0:01:30
75.10%
74.90%
windustry.org
456
2.69
0:01:58
87.94%
58.99%
artshow.com
437
2.28
0:01:03
72.77%
55.61%
ocne.org
434
4.35
0:04:32
38.48%
34.10%
oregon.ctepathways.org
397
8.16
0:11:31
12.59%
40.55%
mypathcareers.org
372
4.95
0:03:52
47.58%
23.66%
capteonline.org
343
5.14
0:03:43
74.93%
11.08%
racc.org
332
2.57
0:01:14
57.23%
31.33%
league.org
263
3.09
0:04:12
37.26%
50.57%
peacehealth.org
263
2.19
0:02:20
15.59%
69.58%
adha.org
227
6.03
0:04:21
68.28%
29.96%
apta.org
214
5.78
0:04:58
71.96%
10.28%
maps.google.com
183
4.58
0:03:30
59.02%
39.89%
mtai.org
182
2.15
0:02:35
61.54%
63.74%
flashalerteugene.net
178
2.55
0:03:58
7.30%
67.42%
ratemyprofessors.com
176
2.91
0:02:10
28.41%
58.52%
florencechamber.com
161
4.27
0:04:35
44.72%
37.27%
lanecountyseniornetwork.com
156
1.93
0:02:07
25.00%
69.87%
4cnas.com
154
1.66
0:02:40
11.04%
78.57%
degreedays.net
152
2.55
0:01:31
90.79%
53.95%
startatlane.com
136
2.63
0:03:11
13.97%
57.35%
healthguideusa.org
134
3.2
0:02:25
79.10%
46.27%
wadsworth.com
134
1.18
0:00:22
85.82%
90.30%
kpflight.com
131
2.35
0:01:46
12.21%
41.98%
Lots of questions spring to mind. Our stats from Wikipedia are pretty good. But when’s the last time anyone cleaned and updated our page? (Answer: May 19th, 2011, when a paragraph was added about the Longhouse , if you don’t count the two pictures added a few weeks back) Our stats from Google Maps are also pretty good, which I’m happy to see – last year I spent a couple days improving our campus map on Google Maps using their mapmaker tool. But since those maps are community edited, is our listing still ok? Are there things we’re missing?
Also interesting is the number of websites that simply list colleges offering a degree. For example, 90% of visits from degreedays.net are new, and are probably people interested in Energy Management. Can we do anything with this data? Are each of those sites linking directly to the program? (degreedays.net does) Do we need to ask any of those sites to update their links, since we’re changing our url structure? (In this case, no – and this is actually a complex question. Email me if you’re concerned).
Conclusions
Phew. That was a lot of data. I’ve only been processing it for a couple hours and I already have dozens of questions to try to answer. But I think its all important stuff to keep in mind as we continue to refine our information architecture. Are we keeping the needs of those 300,000 referral visitors in mind? If we come back to this data in another year or two and look at our bounce rates, will they have gone down, because interesting information is easier to find due to our new Information architecture? Are there any opportunities on any of those sites to increase the number of referrals?
As always, let us know if you’d like to sit down and look through some more complete data for your department.
One of our goals for this redesign has been to simplify the website navigation for our visitors. We’re taking a three pronged approach:
Reduce the number of pages on the site
Unify navigation
Simplify entry page navigation
The first one is the most rewarding – we’re getting rid of pages. So far, we’ve cut 5920 pages by either deleting or moving them to a separate archive site. Hopefully we’re narrowing the focus of our site and reducing the number of links that would take you away from what you’re looking for.
The second two approaches are much harder, and will be the focus of this post. Both require a pretty serious knowledge of where people go our our website, as well as what people are looking for. The first place we’ll look for this data is our own internal search traffic, which we graphed a few posts ago. That gives us 50,000 searches for 3700 different terms over the last three months. We’ll scale it by a factor of 4 to get an estimate of what traffic looks like over the year.
Our second source is much bigger, 1,000,000 searches on Google for 500 different terms. We can immediately throw out the 83% that are people searching for the Lane homepage. Then we can combine similar searches: in addition to obvious misspellings, like “Modle” and “Moodle”, there’s terms like “fall classes” and “spring classes” that are really just searches for “schedule”. It’s important to combine the right things – if we combine too many terms, we’re losing an opportunity to provide a more direct link to a resource. But if we combine too few, then our rankings might not be right.
When we’re all done, we can combine the Google searches with the internal searches, which leaves us with 278 different search terms. Here’s the top ten:
Search Term
Google
Internal
Total
staff directory
8569
7832
16401
mylane
14196
1520
15716
moodle
12314
1756
14070
map
7934
5944
13878
testing
4036
6384
10420
library
6326
2928
9254
jobs
6594
2148
8742
nursing
3403
5252
8655
downtown center
5791
292
6083
express lane
2631
3312
5943
Our next step is to look at our actual page views. That’ll let us validate our search traffic, and tell us where our current navigation works. If a page is getting visited a ton, and no one is searching for it, then we did something right… right?
We’ll look at our 500 most popular URLs. Once again, our first step will be to combine them where appropriate, a job made somewhat more difficult since we’ve been switching URLs around as we move into Drupal. We’ll also look out for things that unfairly influence our page counts. For example, some of the computers on campus automatically open to the computer labs landing page – 65% of the page views on that page are “entrances”, meaning it was the first page viewed. To account for this, we’ll subtract the number of entrances, minus the number of times “computer labs” was searched (searches also generate entrances, and we don’t want to discount those). Our page views will now be:
Views = Views – (Entrances – Traffic from Search)
Sadly, that’s a real pain to calculate due to how our data is set up. But we have a pretty good idea of where this is applicable, so I’ll hand calculate it on the half dozen pages where it’s needed.
When we’re done, here’s our 10 most popular pages:
I’d rather use unique pageviews, to see what pages are important to people, rather than the pages visited most, but unique pageviews are impossible to accurately combine. But we’re really just doing a back of the envelope calculation here, just finding a starting point for our navigation. We’ll perfect it as we look at how people interact with the website after the launch of the new design.
At a quick glance, we see some differences between here and the search data set. But that’s somewhat explained by looking at the pages people go to while applying for admission – the steps to enroll and /esfs/admissions. It seems people don’t search for the application, they search for the institution, then apply. But overall, there’s a good deal of overlap in our two data sets. That’s good – it means our search data is a fairly valid representation of what people look for on our website.
As part of the new design, we’ll be adding landing pages for each of our visitor types. Students, Employees, Future Students, and Community Members will all have a page full of relevant links and information. Since each of those pages will be linked from the homepage, we can create a goal: within two clicks of the homepage you should be able to access all of the pages that account for at least 85% of our page views. Put another way, if you land on the Lane homepage, there should be an 85% chance of getting you where you want to be with only two clicks of the mouse.
In addition to the landing pages, we’ll also have a dedicated Mega Menu on all of our pages on all of our sites. Since there isn’t as much real estate to work with, we can’t have quite as many links. But we’ll also need to use all of the data we’ve collected to build these links with the same goal – the pages people need should be easily accessible.
Unfortunately, now we’ve reached the point where things get a little more subjective.
Some of these links aren’t relevant for some of our visitors. Most new students don’t really care about staff instructions for accessing email.
There’s still grouping to do. We can’t link to each department, but we can link to a department listing. There’s a couple options for this.
Some pages, like guest lecturer information, were only relevant this last year.
We need to consider marketing needs. There’s often a program or event that we’re trying to advertise to campus. We cannot ignore this need – it’s how new programs are discovered.
There’s some things that aren’t links that need to be added to those pages. One example would be announcements about things like financial aid deadlines. We need to get that information out, but it won’t show up in either of our data sources.
In order to avoid any bias from me, I’ll convene a group of people to dig through this data a bit more and build our links and menu using both the search data and the list of popular pages.. When we’re done, it’ll be time to start testing. Expect updates then!