
Two more sites are in Drupal as of this morning:
Speeding up Drupal 7
It’s fairly well accepted that it’s important to have a super fast webpage. We’ve spent much of the last two weeks working on our back end design to make the new Lane webpage as fast as it can possibly be. This blog post will be about sharing our results. A few notes before we begin:
- These tests were conducted mostly on my own laptop, which was busily doing other things, so results aren’t scientific – but it’s good enough for the type of basic improvements we’re going here. On the plus side, this will totally eliminate network effects, since there isn’t really a network.
- We’ll be testing on the development version of our contact page at http://www.lanecc.edu/contact
- Some of these improvements are technically still in testing, and thus you won’t see on the main website (yet). Others were actually implemented weeks ago, but I’m rehashing them here because they’re some of the simplest improvements you can make.
- I’ll be using Firebug to watch the event timeline to see how long things took. This isn’t perfectly accurate, but it’s pretty good for us. And Firebug is amazing.
Baseline
In any testing, you need a baseline. Here’s the timeline for loading the contact page (remember to click on any image to see the full size):
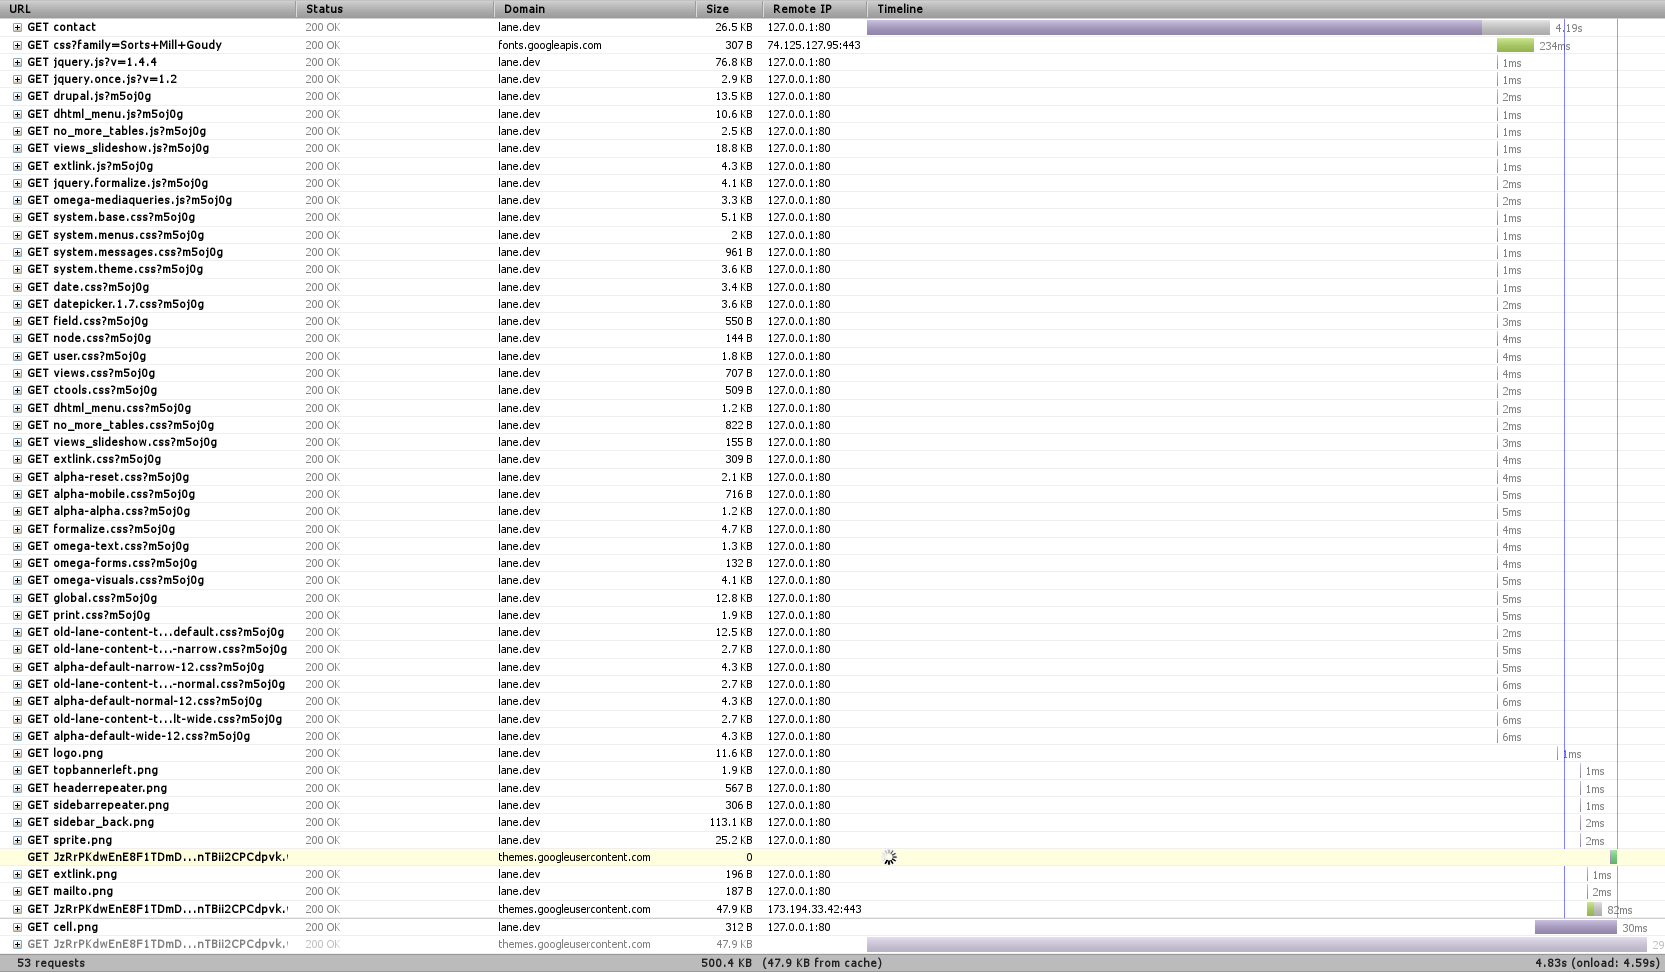
Right away we notice three things – first, that there’s a font that hasn’t finished loading, and which is highlighted in yellow toward the bottom. That’s actually an issue with Firebug, so we can just ignore it.
We also notice that there’s a TON of requests. In this case, 53 (technically 52, since we’re ignoring the font one). When we’re dealing with a local server like this, each of those requests happens super fast. But when we’re dealing with a remote server, like with 99.999% of web requests, there’s a limit of how many requests you can make at one time – always less than 10. So we can get a significant speed boost if we combine requests (You can see some of that limit at the bottom of this post).
Finally, we see a huge purple bar up at top. Any time you see purple in Firebug, that’s when we’re waiting on the server to do something. In this case, we can see that it took about 4 seconds for Drupal to render the page. Surely we can do better!
CSS/JS Aggregation
Our first step will be to combine CSS and Javascript files. We won’t see much of a difference on our tests (things might actually get worse!), but we’ll see a significant improvement on the actual site.

We’re down to 20 requests, just by telling Drupal to combine JavaScript and CSS files where it can. Eliminating 30 requests is actually a significant speedup (Sorry I can’t easily show it here, but you can see other research online).
Also worth noting is the file ‘sprite.png’ that’s listed on there. This is essentially the same idea, applied to images. You can look at our sprite here.
Medium Level: APC
We’re going to skip over the next most obvious method of speeding things up and instead have a look at the Alternative PHP Cache (APC). Drupal is written in PHP, which is an interpreted language. That means that when we process the index.php file, we first turn it from normal PHP code to optcode, which is then run on the PHP virtual machine. APC lets us store (cache) optcode, so that we can skip that first, interpreting step.
The other night, we found that our server was actually freezing on some requests. We had a look at the apc cache, and we found something like this:
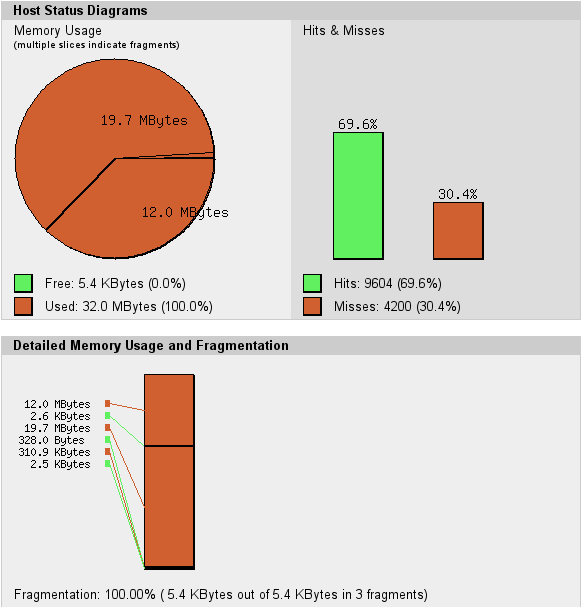
The circle is all red – there’s no more free memory available for APC to use to cache optcode. Our memory is also fragmented – APC can’t keep things near each other, which is going to make the cache work harder than it should. Together, these two things make us ‘miss’ the cache – on my computer, there were 4200 opportunities to speed things up that we missed. So we simply increased the cache size.
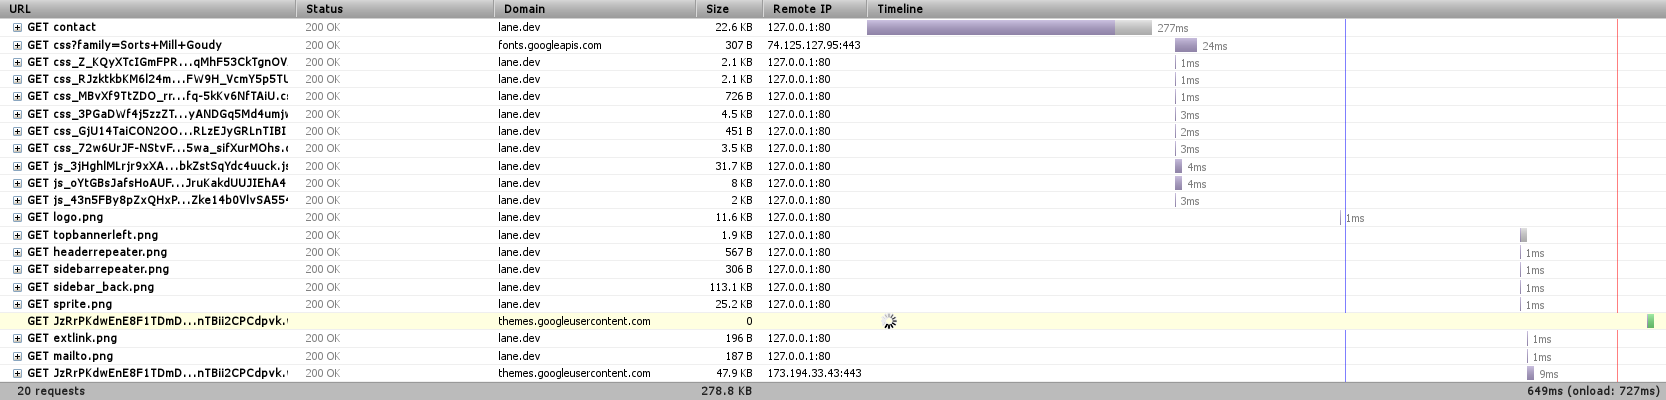
Now we’re loading the entire page in 640ms, and it’s only taking Drupal 277ms to get us the page content – less than 1% of the time it took before.
Medium Level: MySQL Caching
The other place to do caching is our database. Some types of requests to the database are really simple, repetitive things that could easily be stored in memory instead of on disk. MySQL provides a query cache where it learns what those things are. By default, this cache is turned off. If we turn it back on:

Now Drupal is able to get us that page in 212 ms – almost 25% faster.
Now what?
So we’re pretty quick. But, being programmers, we’re never satisfied. On our actual server we’re also:
- Minifying additional JavaScript & CSS
- Tuning our Web Server parameters so that we always have something waiting for your web page request
- Pushing some resources onto a Content Delivery Network (videos, fonts, some JavaScript), so that they’re shared between multiple websites, reducing the likelihood you’ll need to download them.
- Running much JavaScript from the bottom of the page instead of the head, so that the page will render in your browser before doing Javascript – giving the appearance of it being faster.
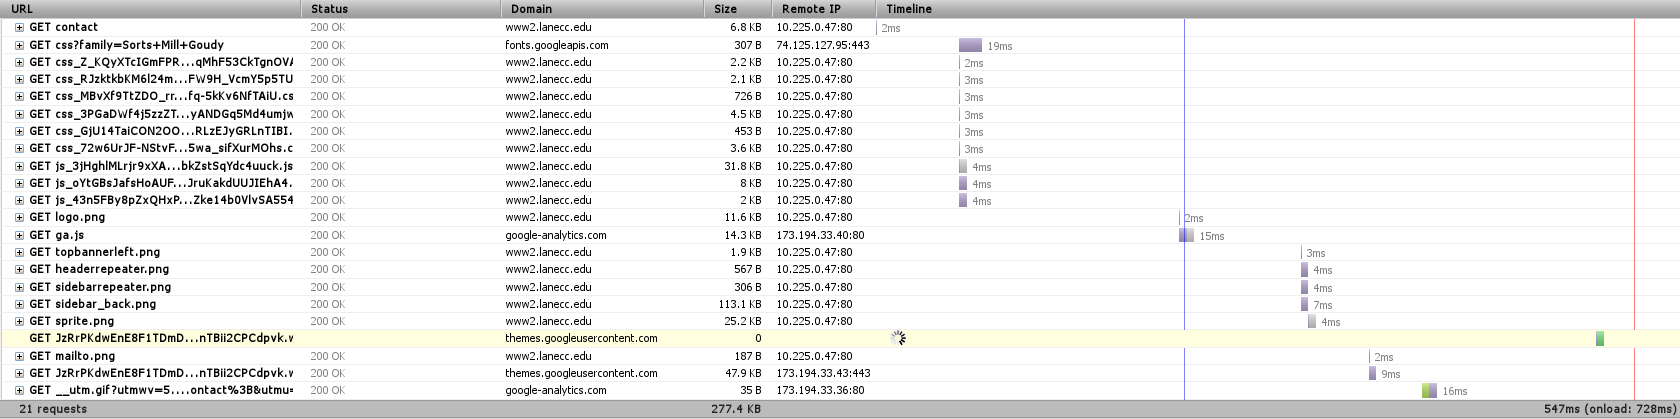
Here’s the timeline from the actual server to my computer, as it is right now:

But there’s one more big thing we can do.
Anonymous User Caching
When Drupal renders a page, it needs to fetch information from the database, process a bunch of templates, check user permissions on a ton of objects, and then build the page. Then Apache, our web server, needs to serve that page to you. Apache is a good web server, but it’s a general purpose web server, designed to serve many different languages. There are faster alternatives.
We currently have a server in testing which is designed from the ground up to serve pages as fast as it possible. Pages loaded from that look like this:
Our Varnish server is an entire separate server that sites between you and Drupal and does nothing but determine what pages could be stored in RAM as complete pages, ready and waiting for when you want them. In this case, it was able to return the contact page to me in 2ms – most of the rest of the time was spent waiting for other resources – CSS, Javascript, and fonts – to load. Now it’s obvious why reducing the number of HTTP requests would speed up our page load – those bottom requests would be made sooner.
Varnish posed a special problem for us these last two months while we were testing it. First, it doesn’t do encrypted traffic. For that we have a separate nginx server, which takes care of passing your encrypted requests straight to Drupal. But our second, more fun problem was figuring out how to load test Varnish. My laptop wasn’t strong enough, then our other web server wasn’t strong enough, and then a set of 5 other machines on the same network weren’t strong enough. Varnish was able to handle thousands of requests per second, and not even blink.
Finally
Thanks for sticking with me this long! Except a much faster web site before the end of the month, as we finally turn on Varnish for the rest of the world. And we know there’s still work to be done. Our next design should feature fewer requests and less JavaScript, letting your page load and render just a little bit faster.
50% Processed
We deployed just one site today: Career and Employment Services. But with that deployment we are officially at 50% of pages processed. Of the 13,000 pages that we had to work through this year, we’ve either migrated, cut, or archived half of them.Have a good weekend!
Two More
Over 10% Moved
As of this morning, over 10% of our pages have been completely moved into Drupal:
Be sure to note the newer, simplified pages for Board of Education meeting minutes and policies.
First Deployments of June
Three more sites are now live in Drupal:
Some of the other, more exciting (for us, anyway!) things we’ve been doing this week include implementing a 700% performance improvement in our Migration Tracker and cutting 20,000 lines of old, unused Drupal Module Code out (this doesn’t directly impact speed, except in some special situations, but it still feels good!).
Responsive Tables
Before I get started, I should warn you, I’m putting my geek cap on for this one.
If you’ll recall, the new Lane web design is responsive (if you don’t remember what that means, check out the original post). Unfortunately, there are two parts of our website that dislike being responsive: images and tables.
The problem with images has to do with size. If you’re on a cell phone, you have very limited screen space. So you don’t want to download big huge images, only to have your cell phone shrink them down. That wastes both bandwidth and processing time on your phone. In other words, it’s a slow page. But despite that problem, at least the page still works and looks right.
Tables are a different story. Here’s an example of a non-responsive table:
| Program | Entry/Application | Application Deadline | Prerequisites | Schedule/Location | Contact Person |
| Bridge to C.N.A. | Application tk | Bridge Prerequisites | TBA / LCC | Juanita Kirkham | |
| C.N.A. I | Application tk | C.N.A. I Prerequisites | TBA | Juanita Kirkham | |
| Healthcare Professions Orientation | Call (541) 463-5223 to reserve your space |
Open until filled | – | TBA /LCC | WorkSource Lane at LCC Staff |
| Fundamentals of Microsoft Word 2010 for the Workplace | Call (541) 463-5223 to be placed on waiting list | Open until filled | Typing Speed: 15 words per min. | Ongoing two 5 week sessions a term/LCC | WorkSource Lane at LCC Staff |
| Fundamentals of Microsoft Excel 2010 for the Workplace | Call (541) 463-5223 to be placed on waiting list | Open until filled | Typing Speed: 15 words per min. | Ongoing two 5 week sessions a term/LCC | WorkSource Lane at LCC Staff |
| Basic Computer for the Workplace | Call (541) 463-5223 to reserve your space |
Open until filled | – | Ongoing-3 weeks/LCC | WorkSource Lane at LCC Staff |
Look ok? Try making your screen narrower or viewing this post on a cell phone. Your web browser recognizes that this is tabular data, and that it doesn’t make much sense if you can’t see the entire row. But your web browser also runs into a hard limit – the width of your screen. As your screen shrinks, the web browser will continue trying to reflow the text – meaning re-lay it out – in the table. But eventually, either the table needs fewer columns or the browser needs to break words apart to get things to fit. Neither answer works. So it just draws some of the table off the right edge.
This can be real problem on a mobile phone. In a best case, it’s just kind of ugly, and you can scroll the page with your finger to see off the right edge. In the worst case, the phone won’t let you scroll (or you’re on an older device where you can’t scroll), and you can’t see the right side of the table at all.
There’s been a series of excellent write ups on different ways to approach this problem, so I won’t rehash them all here. We considered two – flip scroll and “no-more-tables“.
First, we tried Flip Scroll. It’s an almost ideal method – it preserves the visual layout of the table, without adding much additional content. But we found that it didn’t render correctly in earlier (1.x and 2.x) Android devices, which represent the majority of our Android users. There were also some concerns with accessibility, since it makes it harder to tell how rows flow together. So we moved on to “No-More-Tables”. This method does change the visual appearance on mobile, but it was supported on the dozen devices I tested.
To see these tables in action, take a look at any page on the Lane webpage that has a large table on it, such as the the Workforce Development Short Term Trainings page. Because we’re rendering tables responsively on the client side, nothing needs to change for our content editors – they just keep on making tables like normal. The only exception to this rule is if there’s a table where the data series are in rows rather than columns. If that sounds like a problem you might have, see the table documentation on the internal Drupal Help Site.
If you’re interested in knowing more about Drupal and/or responsive tables, let me know in the comments, and I can publicize the mini modules we made to try each of these techniques.
EDIT (7/31/12) – One of these modules is available on Github
Better Ways to Track Progress
In an effort to understand the progress we’re making, we spent a few minutes earlier this week figuring out what the biggest “chunks” of the website are. Of course, once we had some data, we had to do a little bit of analysis. The results are now linked on the menu bar up above under “Current Progress“.
On that page, there’s two graphs which display the percent of our chunks in these five statuses:
| Status | Meaning |
|---|---|
| Cut | Chunks that are just going away – still stored on backups, but not linked from anywhere. |
| Archive | Chunks that pertain to old projects that need to be kept around for either legal or historical reasons. They’ll be stored on the Site Archive |
| Review | Chunks that have been moved into Drupal, but need a final review before deployment |
| Done | Chunks already moved into Drupal |
| Not Complete | Chunks still on the old web server. This is chunks that are in progress or haven’t been started |
Here’s the first graph, which shows the percentage of individual pages in each status:
Here’s the second graph, which shows the percentage of departments in each status*:
The best part about these graphs is that they update every time we update our spreadsheet. So, some day several months down the road, instead of these images showing a lot of grey with a little bit of yellow, they’ll show a lot of orange and no grey at all.
Unfortunately, I only have statistics for the pages that are still on the web server. If I included the work done last summer, when we deleted over 5000 pages, which would have made that first graph 46% blue!
* technically, this is the percentage of top level folders on the web server in each status, but that’s a pretty close approximation to departments.
Deployments this week
Three more sites are up in Drupal this week, including some that were never on the web before:
There’s also been a good deal of progress toward improving our backend setup, including fixing our version control server, more tuning and testing of our two reverse proxy servers, and quite a bit of work in fixing our forms handling. Expect to see bigger chunks in Drupal next week!
1000 pages!
By deploying another 6 departments to Drupal, we now officially have more than 1000 web pages in Drupal! Here’s the 6 “chunks” we deployed this week: